One of the WWDC 2015 announcements that surprised interested us the most has definitely been the support for code coverage for the Swift language.
In this article we will understand the advantages of the new code coverage functionality introduced in Xcode 7 and how to integrate such KPI in our daily work.
French speakers: the original version of this article is actually French, and you can read it on Xebia’s excellent blog.
Also, this article is the text version of the talk “Leveraging Xcode Code Coverage”, presented at the Mobile Optimized conference in Minsk, whose slides are available here.
Code coverage is a metric that measures the value of our tests by identifying what code is executed when running them and, above all, what portions of our project are untested.
How it works?
The production of code coverage information is done in two passes:
- At compile time, the compiler prepares the files for analysis
- At runtime, the lines of code affected by the tests are annotated in a specific file
Xcode code coverage before June 2015
Before WWDC 2015, only the Objective-C code coverage was supported by Apple’s tools, while Swift had been left behind. Also, the Objective-C support was sometimes inconsistent and required a few tricks to get the information.
How did it work?
The procedure necessary to retrieve the information was a variant of the one used by gcov, included in the gcc tools. Two settings had to be added to the Build Settings:
- Generate test coverage files, which corresponds to the -ftest-coverage gcc flag
- Instrument program flow, corresponding to -fprofile-arcs
The former allows the creation of the .gcno files, which contain the information needed to build the execution graph and reconstruct the line numbers.
The latter, Instrument program flow, deals with the creation oft the .gcda files, which contain the number of transitions on different arcs of the graph and other summary information.
In order to force the generation of these command line data, it was possible to use the following command:
GCC_INSTRUMENT_PROGRAM_FLOW_ARCS=YES
    GCC_GENERATE_TEST_COVERAGE_FILES= YES
    xcodebuild [...]
    test
Exploiting the data
A number of tools for reading and exporting reports exist, but in particular, we used the following:
- Coverstory, a GUI tool to read files “.gcda” and “.gcno”
- gcovr translates these files Cobertura XML format
- lcov generates a visual report in a navigable HTML
- and, especially, Slather.
Slather
Slather, developed by the SF-based company Venmo, exports the code coverage data in a number of different formats, including Gutter JSON, Cobertura XML, HTML and plain text. In addition, it integrates easily with other platforms, such as Jenkins, Travis CI, Circle CI and coveralls.
As said, one of the major assets of Slather is its ease of configuration and integration within a continuous integration system. Slather is open source, and available here at Venmo’s GitHub repo.
Swiftcov
A recent tool for collecting Swift coverage information is Swiftcov, developed by the guys at Realm. Swiftcov makes heavy use of LLDB breakpoints to detect which lines are affected by the execution of our tests.
Code coverage after June 2015
During the WWDC 2015 keynote, Apple announced that Xcode 7 would introduce support of code coverage for our beloved Swift.
How does it work?
A completely new format has been introduced, named profdata, thus making
gcov legacy – at least for what concerns projects developed with Apple’s development tools.
In other words, starting from the very first beta of Xcode 7, profdata is intended to replace completely gcov for both Swift and Objective-C.
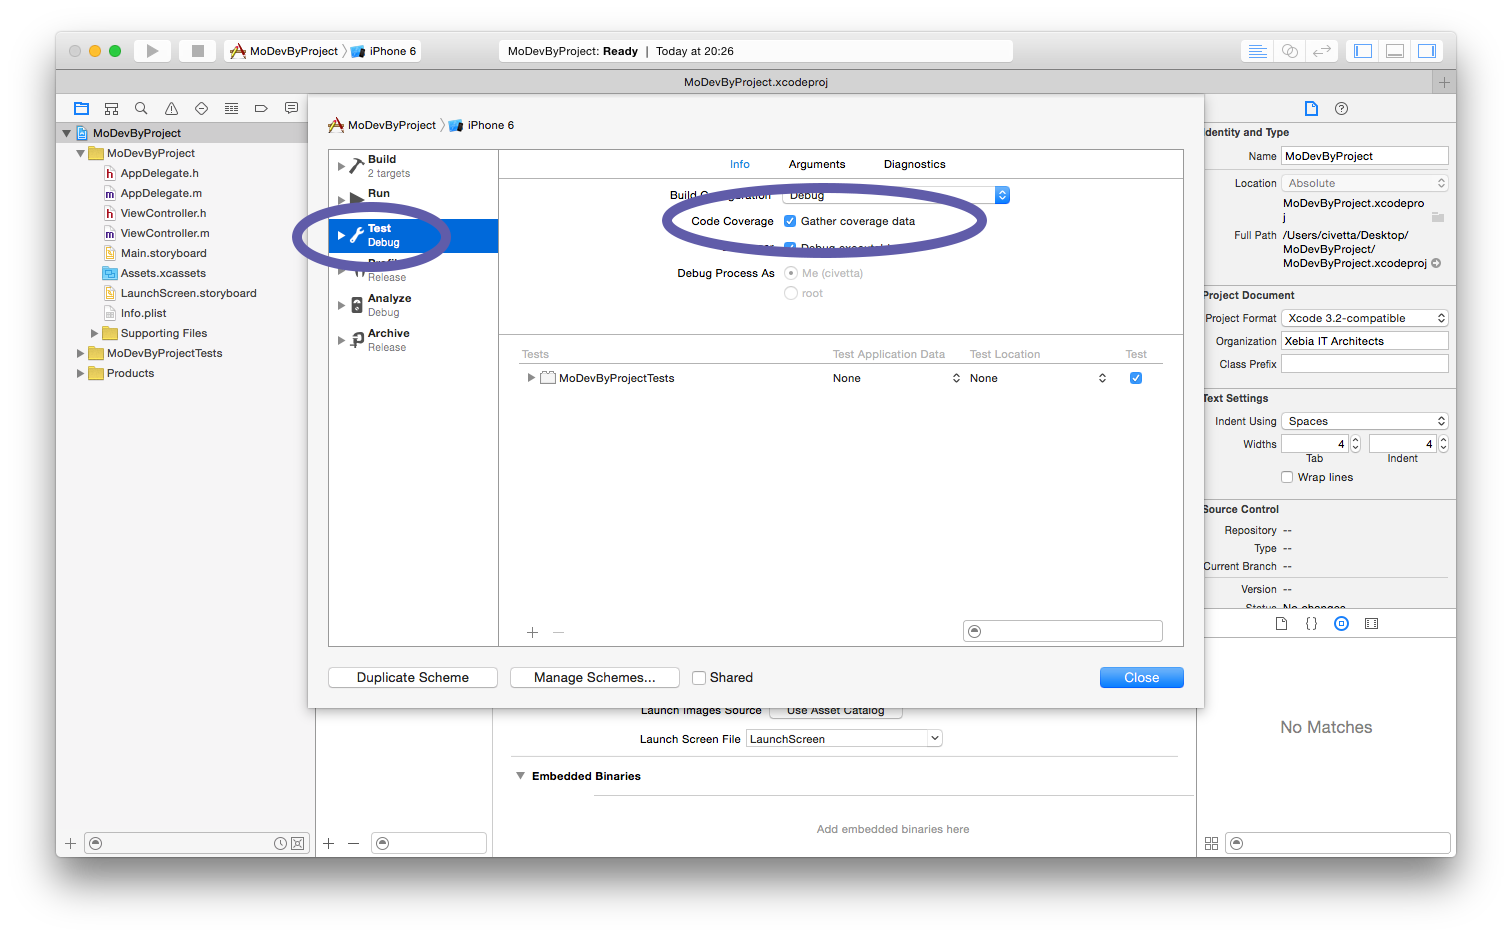
In order to enable the setting, from Xcode 7, you will need to access the “scheme” setting and, in the “Test” tab, to tick the “Gather coverage data” checkbox.
As for the command line, xcodebuild now ships with a new parameter, -enableCodeCoverage, which can be used as follows:
xcodebuild
    -scheme MoDevByProject
    -destination "name=iPhone 6,OS=latest"
    -enableCodeCoverage YES
    test
Once the tests run, coverage information is immediately available in Xcode, on the right side of the code editor (see image below) and, in particular, in the “Report Navigator”.
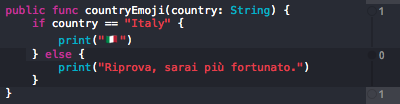 Inline code coverage information
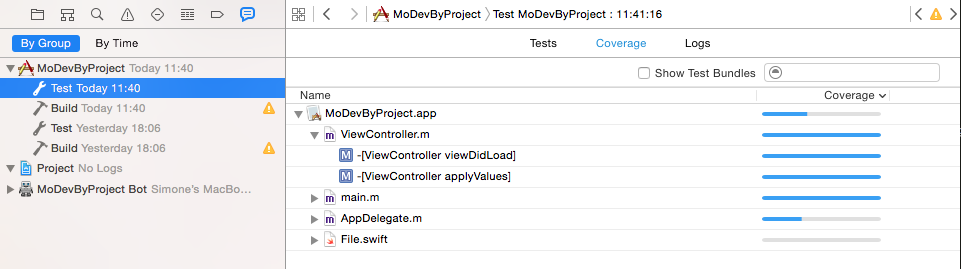 The new Report Navigator
The Report Navigator shows in detail which classes are covered by our tests and, by expanding the selection, which methods are actually used.
Exploiting the data
Apple’s work hasn’t only consisted in enhancing Xcode but, also, in extending the features of the llvm-cov command line tool, which allows working with .profdata format.
The llvm-cov show command, for instance, allows exporting plain text coverage information and outputs annotated source code files, which can be easily read and processed.
Slather (returns)
A recent Pull Request allows Slather to work with profdata files and convert them to other formats, thus enabling the integration with the other platforms supported by the tool.
Xcode Server
If you are thinking about setting up an automated integration system, aside from the excellent Jenkins, Travis or Circle CI, it is perhaps time to start taking into consideration Xcode Server, which is part of the OS X Server bundle, distributed free of charge by Apple.
With the new version of Xcode bots and Xcode Server, it is now possible to support code coverage values and to display the results in a Web browser. The reports are also available in the “Big Screen” presentation, useful for presenting your content in a simplified yet effective overview.
In order to enable this workflow, you could follow the steps below:
- Install OS X server
- Enable “Xcode” and “Websites” services
- Create a new project and assign a Source Control Manager to it (such as git)
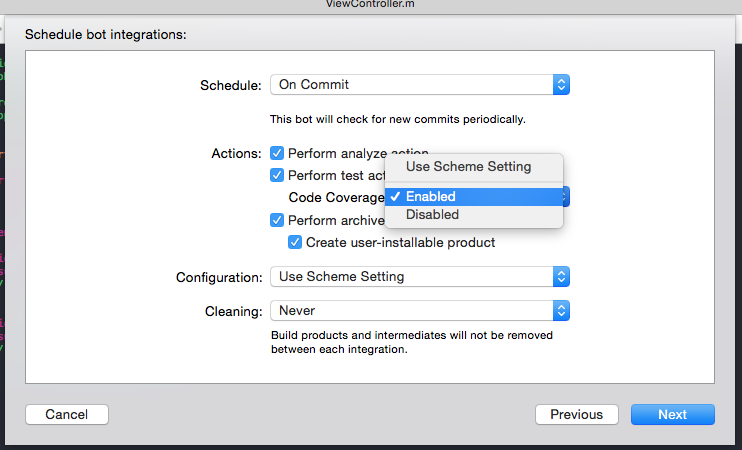
- In Xcode, create an Xcode bot under “Product > Create Bot”
- Select the frequency of integration and enable code coverage (see image below) next to the caption “Code Coverage”.
- Launch an integration
- Open the web browser at the host indicated by your instance of Mac OS.
 Xcode Bot creation panel
Conclusion
Code coverage is very useful to keep under control your code base health status. Although it can not replace your developer confidence in well designed, well structured apps, this metric can help write better code by encouraging you to give yourself concrete goals day by day.
Also, and finally, the new tools offered by Apple can now allow you to keep under control these values in minutes, with a simple and immediate configuration.